blogjewishscene.blogspot.com
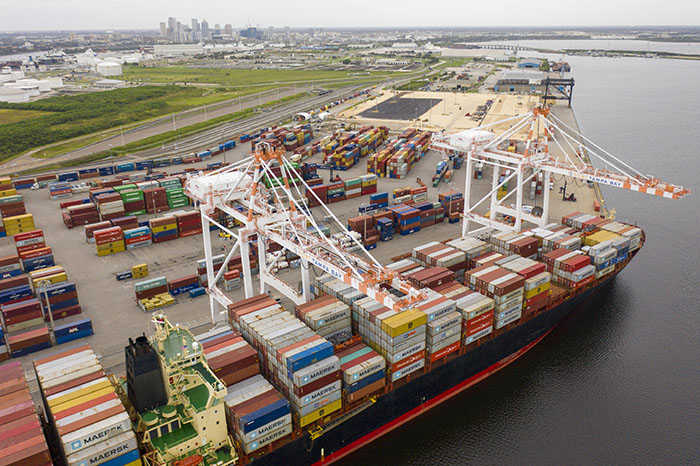
Imports through the top nine US Gulf Coast ports fell 2.3 percent year over year through July, while exports slipped 1.6 percent. Photo credit: Port Tampa Bay.
Containerized cargo volumes flowing through the busiest US Gulf Coast ports declined marginally in the first seven months of 2020, buffeted by the damaging effects of the COVID-19 pandemic on global consumer demand but buoyed by continued — albeit much slower — growth in resin exports and an expanding share of imports from Asia.
The nine largest gateways for container cargo on the US Gulf Coast handled a total of 2.05 million TEU through July, a 2 percent decrease from the same seven months in 2019, according to the JOC Top 9 US Gulf Ports 2020 rankings. Imports through those ports fell 2.3 percent year over year during the period, while exports slipped 1.6 percent.
Port Houston, which continues to dominate the Gulf Coast market, accounting for more than two out of every three boxes that move in and out of the region, saw its import volumes fall 4.7 percent to 685,889 TEU during the period as COVID-19 lockdowns brought the US economy to a standstill. But only two other ports registered year-over-year declines in imports in the first seven months of 2020: Gulfport (down 7.7 percent) and Galveston (down 0.5 percent).
On the export side, volumes through Houston actually increased, ticking up 1.2 percent to 713,366 TEU compared with the first seven months of 2019, thanks in large part to increased resin production in the region. Total outbound shipments of resins from the United States grew 6.8 percent to 542,762 TEU through July, according to data from PIERS, a sister company of JOC.com within IHS Markit.
Export gains were also recorded in Mobile (14.7 percent), Galveston (14.3 percent), and Tampa (11.4 percent), but that growth was offset by declines at New Orleans (3.1 percent), Freeport (17.4 percent), Gulfport (55.3 percent), Panama City (3.2 percent), and Manatee (87.8 percent).
JOC.com’s Top US Gulf Coast Ports and Container Carriers rankings are compiled using data from PIERS. Volume figures are expressed in 20-foot equivalent units (TEU). One standard 40-foot ocean container equals two TEU. Non-containerized cargoes — i.e., dry bulk, liquid bulk, roll-on/roll-off (ro-ro), and oversized/heavy-lift project freight — are not included.
Rankings compiled by Marcin Lejk, data analyst.
JOC Top 9 US Gulf Coast Ports by Imports
|
| US Gulf Coast imports, January-July 2020 vs. January-July 2016, 2017, 2018, and 2019 in laden TEU |
|
| 2020 Rank |
US Gulf Coast Port |
Jan.-July 2020 Market Share |
| January–July Volume |
| 2017 |
2018 |
2019 |
2020 |
|
Percent Volume Change in
Jan.-July 2020 |
| From 2017 |
From 2018 |
From 2019 |
|
|
| 1 |
Houston, TX |
66.3% |
601,737 |
663,315 |
719,969 |
685,889 |
14.0% |
3.4% |
-4.7% |
| 2 |
Mobile, AL |
10.8% |
67,734 |
69,183 |
111,659 |
111,685 |
64.9% |
61.4% |
0.0% |
| 3 |
New Orleans, LA |
7.9% |
60,294 |
73,021 |
81,059 |
81,296 |
34.8% |
11.3% |
0.3% |
| 4 |
Gulfport, MS |
4.4% |
54,589 |
49,462 |
49,118 |
45,330 |
-17.0% |
-8.4% |
-7.7% |
| 5 |
Tampa, FL |
3.4% |
20,150 |
27,499 |
33,217 |
35,668 |
77.0% |
29.7% |
7.4% |
| 6 |
Manatee, FL |
2.6% |
14,995 |
14,159 |
24,317 |
26,784 |
78.6% |
89.2% |
10.1% |
| 7 |
Freeport, TX |
1.9% |
19,283 |
20,246 |
17,329 |
19,368 |
0.4% |
-4.3% |
11.8% |
| 8 |
Panama City, FL |
1.7% |
9,522 |
8,963 |
11,381 |
17,233 |
81.0% |
92.3% |
51.4% |
| 9 |
Galveston, TX |
1.1% |
9,724 |
10,287 |
11,063 |
11,010 |
13.2% |
7.0% |
-0.5% |
| TOTAL JOC TOP 9 US GULF IMPORT PORTS |
858,028 |
936,133 |
1,059,111 |
1,034,263 |
20.5% |
10.5% |
-2.3% |
| TOTAL US GULF IMPORTS |
859,094 |
938,020 |
1,059,780 |
1,034,879 |
20.5% |
10.3% |
-2.3% |
JOC Top 9 US Gulf Coast Ports by Exports
|
| US Gulf Coast exports, January-July 2020 vs. January-July 2016, 2017, 2018, and 2019 in laden TEU |
|
| 2020 Rank |
US Gulf Coast Port |
Jan.-July 2020 Market Share |
| January–July Volume |
| 2017 |
2018 |
2019 |
2020 |
|
Percent Volume Change in
Jan.-July 2020 |
| From 2017 |
From 2018 |
From 2019 |
|
|
| 1 |
Houston, TX |
70.0% |
587,662 |
597,805 |
705,072 |
713,366 |
21.4% |
19.3% |
1.2% |
| 2 |
New Orleans, LA |
16.3% |
174,419 |
159,313 |
171,617 |
166,289 |
-4.7% |
4.4% |
-3.1% |
| 3 |
Mobile, AL |
8.0% |
74,405 |
77,431 |
70,914 |
81,353 |
9.3% |
5.1% |
14.7% |
| 4 |
Freeport, TX |
2.1% |
20,765 |
17,755 |
25,583 |
21,140 |
1.8% |
19.1% |
-17.4% |
| 5 |
Gulfport, MS |
2.0% |
33,745 |
45,864 |
46,691 |
20,869 |
-38.2% |
-54.5% |
-55.3% |
| 6 |
Galveston, TX |
0.7% |
4,365 |
3,698 |
5,794 |
6,624 |
51.8% |
79.1% |
14.3% |
| 7 |
Tampa, FL |
0.5% |
5,695 |
2,701 |
4,700 |
5,234 |
-8.1% |
93.8% |
11.4% |
| 8 |
Panama City, FL |
0.4% |
5,038 |
5,110 |
3,747 |
3,628 |
-28.0% |
-29.0% |
-3.2% |
| 9 |
Manatee, FL |
0.0% |
4,263 |
1,026 |
488 |
59 |
-98.6% |
-94.2% |
-87.8% |
| TOTAL JOC TOP 9 US GULF EXPORT PORTS |
910,355 |
910,702 |
1,034,604 |
1,018,561 |
11.9% |
11.8% |
-1.6% |
| TOTAL US GULF EXPORTS |
910,450 |
911,845 |
1,034,996 |
1,018,583 |
11.9% |
11.7% |
-1.6% |
JOC Top 10 Container Carriers by US Gulf Coast Imports
|
| US Gulf Coast imports, January-July 2020 vs. January-July 2016, 2017, 2018, and 2019 in laden TEU |
|
| 2020 Rank |
Ocean Carrier |
Jan.-July 2020 Market Share |
| January–July Volume |
| 2017 |
2018 |
2019 |
2020 |
|
Percent Volume Change in
Jan.-July 2020 |
| From 2017 |
From 2018 |
From 2019 |
|
|
| 1 |
A.P. Møller - Maersk* |
20.3% |
157,003 |
190,400 |
233,471 |
209,797 |
33.6% |
10.2% |
-10.1% |
| 2 |
Mediterranean Shipping Co. (MSC) |
19.8% |
153,463 |
176,059 |
204,349 |
204,434 |
33.2% |
16.1% |
0.0% |
| 3 |
CMA CGM/APL |
18.1% |
123,225 |
142,802 |
176,338 |
187,204 |
51.9% |
31.1% |
6.2% |
| 4 |
Hapag-Lloyd |
10.5% |
98,094 |
99,763 |
112,824 |
108,905 |
11.0% |
9.2% |
-3.5% |
| 5 |
Cosco Shipping/OOCL |
8.8% |
96,146 |
92,916 |
98,657 |
91,210 |
-5.1% |
-1.8% |
-7.5% |
| 6 |
Dole |
3.9% |
41,553 |
43,958 |
39,674 |
40,516 |
-2.5% |
-7.8% |
2.1% |
| 7 |
Zim Integrated Shipping Services |
3.3% |
38,675 |
50,374 |
33,882 |
33,853 |
-12.5% |
-32.8% |
-0.1% |
| 8 |
Evergreen Line |
2.8% |
11,245 |
21,702 |
28,371 |
28,743 |
155.6% |
32.4% |
1.3% |
| 9 |
World Direct Shipping |
2.0% |
6,713 |
6,494 |
15,456 |
20,585 |
206.6% |
217.0% |
33.2% |
| 10 |
Linea Peninsular |
1.7% |
13,709 |
12,817 |
15,261 |
18,071 |
31.8% |
41.0% |
18.4% |
| TOTAL JOC TOP 10 US GULF IMPORT CARRIERS |
739,826 |
837,286 |
958,283 |
943,318 |
27.5% |
12.7% |
-1.6% |
| TOTAL US GULF IMPORTS |
859,094 |
938,020 |
1,059,780 |
1,034,879 |
20.5% |
10.3% |
-2.3% |
| |
*A.P. Møller - Maersk includes Maersk Line, Sealand, Safmarine, and Hamburg Sud.
Source: IHS Markit |
JOC Top 10 Container Carriers by US Gulf Coast Exports
|
| US Gulf Coast exports, January-July 2020 vs. January-July 2016, 2017, 2018, and 2019 in laden TEU |
|
| 2020 Rank |
Ocean Carrier |
Jan.-July 2020 Market Share |
| January–July Volume |
| 2017 |
2018 |
2019 |
2020 |
|
Percent Volume Change in
Jan.-July 2020 |
| From 2017 |
From 2018 |
From 2019 |
|
|
| 1 |
Mediterranean Shipping Co. (MSC) |
24.3% |
213,947 |
197,423 |
246,754 |
247,478 |
15.7% |
25.4% |
0.3% |
| 2 |
A.P. Møller - Maersk* |
21.0% |
205,879 |
210,217 |
232,063 |
213,573 |
3.7% |
1.6% |
-8.0% |
| 3 |
CMA CGM/APL |
17.1% |
134,039 |
128,532 |
154,902 |
173,767 |
29.6% |
35.2% |
12.2% |
| 4 |
Hapag-Lloyd |
13.6% |
107,984 |
124,690 |
144,754 |
138,751 |
28.5% |
11.3% |
-4.1% |
| 5 |
Cosco Shipping/OOCL |
6.6% |
56,557 |
57,816 |
65,419 |
67,258 |
18.9% |
16.3% |
2.8% |
| 6 |
Seaboard Marine |
4.3% |
51,700 |
50,528 |
46,669 |
43,424 |
-16.0% |
-14.1% |
-7.0% |
| 7 |
Evergreen Line |
3.7% |
6,418 |
18,796 |
17,393 |
38,024 |
492.5% |
102.3% |
118.6% |
| 8 |
Zim Integrated Shipping Services |
2.5% |
31,041 |
24,364 |
24,380 |
25,696 |
-17.2% |
5.5% |
5.4% |
| 9 |
Ocean Network Express |
1.4% |
11,040 |
10,605 |
18,068 |
14,044 |
27.2% |
32.4% |
-22.3% |
| 10 |
Great White Fleet |
1.1% |
23,901 |
19,698 |
14,724 |
11,062 |
-53.7% |
-43.8% |
-24.9% |
| TOTAL JOC TOP 10 US GULF EXPORT CARRIERS |
842,505 |
842,670 |
965,126 |
973,076 |
15.5% |
15.5% |
0.8% |
| TOTAL US GULF EXPORTS |
910,450 |
911,845 |
1,034,996 |
1,018,583 |
11.9% |
11.7% |
-1.6% |
| |
*A.P. Møller - Maersk includes Maersk Line, Sealand, Safmarine, and Hamburg Sud.
Source: IHS Markit |
Let's block ads! (Why?)
"port" - Google News
November 02, 2020 at 08:02PM
https://ift.tt/2Gjtbx9
JOC Rankings: Resins buoy US Gulf Coast ports during COVID-19 - JOC.com
"port" - Google News
https://ift.tt/2VXul6u
https://ift.tt/2WmIhpL

No comments:
Post a Comment